LLM-as-a-Judge
Use an LLM to automatically score your application outputs. For this evaluation method, the LLM is presented with your application’s input and output and asked to score and reason about the output. It will then produce a score including a comment with chain-of-thought reasoning.
Why use LLM-as-a-Judge?
- Scalable: Judge thousands of outputs quickly versus human annotators.
- Human‑like: Captures nuance (e.g. helpfulness, toxicity, relevance) better than simple metrics, especially when rubric‑guided.
- Repeatable: With a fixed rubric, you can rerun the same prompts to get consistent scores.
How to use LLM-as-a-Judge?
LLM-as-a-Judge evaluators can run on three types of data: Observations (individual operations), Traces (complete workflows), or Experiments (controlled test datasets). Your choice depends on whether you’re testing in development or monitoring production, and what level of granularity you need.
Decision Tree
Which data needs to be evaluated?
Production Pattern: Teams typically use Experiments during development to validate changes, then deploy Observation-level evaluators in production for scalable, precise monitoring.
Understanding Each Evaluation Target
Evaluate live production traffic to monitor your LLM application performance in real-time.
Run evaluators on individual observations within your traces—such as LLM calls, retrieval operations, embedding generations, or tool calls.
Why target Observations
- Dramatically faster execution: Evaluations complete in seconds, not minutes. Eliminates evaluation delays and backlogs. Asynchronous architecture processes thousands of evaluations per minute.
- Operation-level precision: Filter by observation type to evaluate only final LLM responses or retrieval steps, not entire workflows. Reduces evaluation volume and cost by targeting specific operations.
- Compositional evaluation: Run different evaluators on different operations within one trace. Toxicity on LLM outputs, relevance on retrievals, accuracy on generations—simultaneously.
- Combined filtering: Stack observation filters (type, name, metadata) with trace filters (userId, sessionId, tags, version). Example: “all LLM generations in conversations tagged ‘customer-support’ for premium users”.
Data Flow
At ingest time, each observation is evaluated against your filter criteria. Matching observations are added to an evaluation queue. Evaluation jobs are then processed asynchronously. Scores are attached to the specific observation, resulting in one score per observation per evaluator. Depending on your filter criteria, multiple observations may match the criteria and result in multiple scores per trace.
Example Use Cases
- Evaluate helpfulness of only the final chatbot response to users
- Monitor toxicity scores on all customer-facing LLM generations
- Track retrieval relevance for RAG systems by targeting document retrieval observations
Set up step-by-step
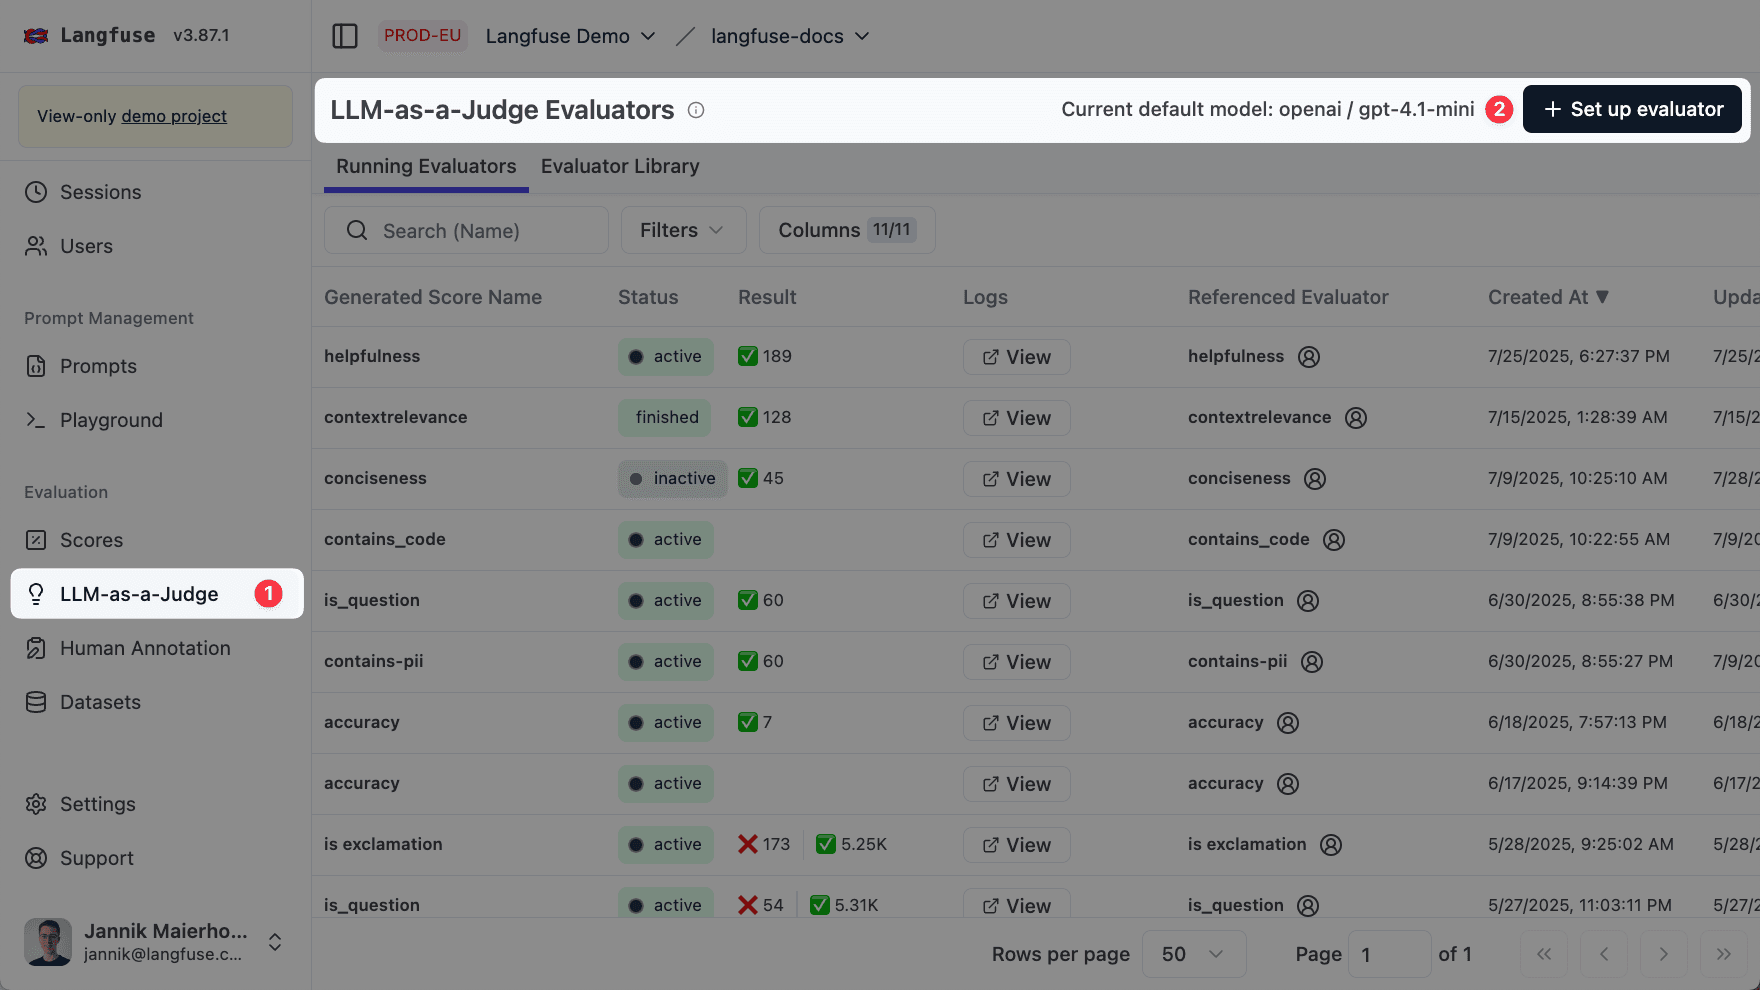
Create a new LLM-as-a-Judge evaluator
Navigate to the Evaluators page and click on the + Set up Evaluator button.
Set the default model
Next, define the default model used for the evaluations. This step requires an LLM Connection to be set up. Please see LLM Connections for more information.
It’s crucial that the chosen default model supports structured output. This is essential for our system to correctly interpret the evaluation results from the LLM judge.
Pick an Evaluator
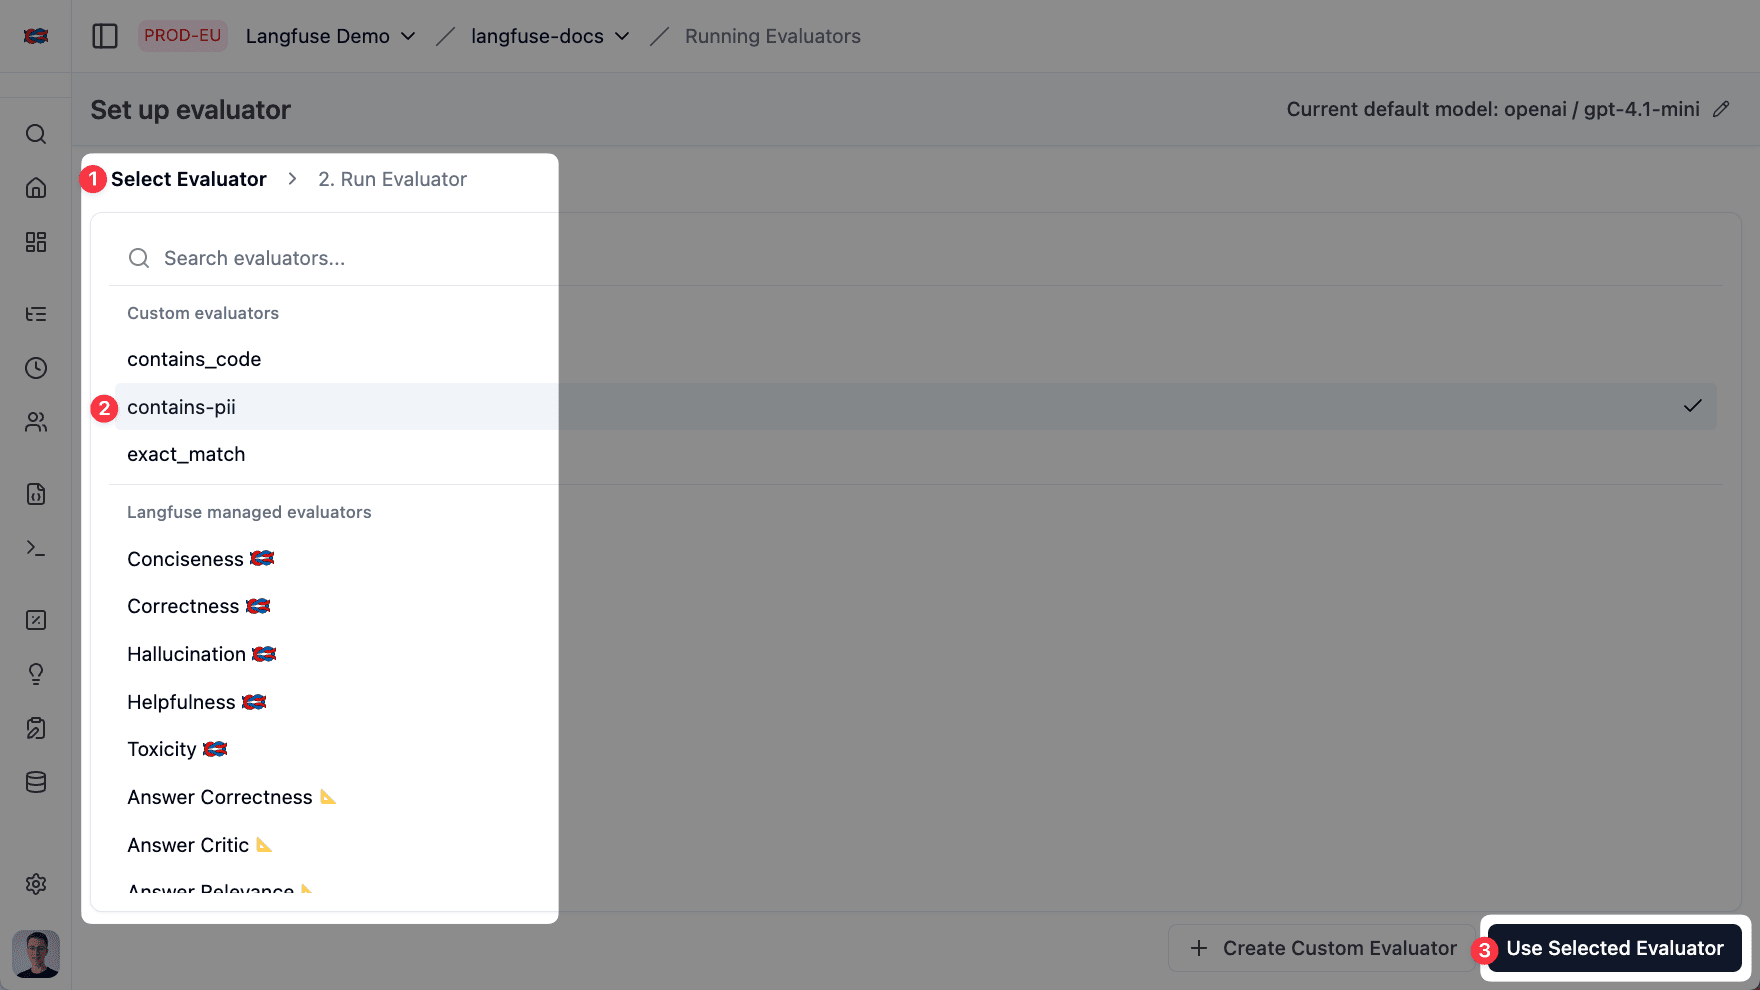
Next, select an evaluator. There are two main ways:
Langfuse ships a growing catalog of evaluators built and maintained by us and partners like Ragas. Each evaluator captures best-practice evaluation prompts for a specific quality dimension—e.g. Hallucination, Context-Relevance, Toxicity, Helpfulness.
- Ready to use: no prompt writing required.
- Continuously expanded: by adding OSS partner-maintained evaluators and more evaluator types in the future (e.g. regex-based).
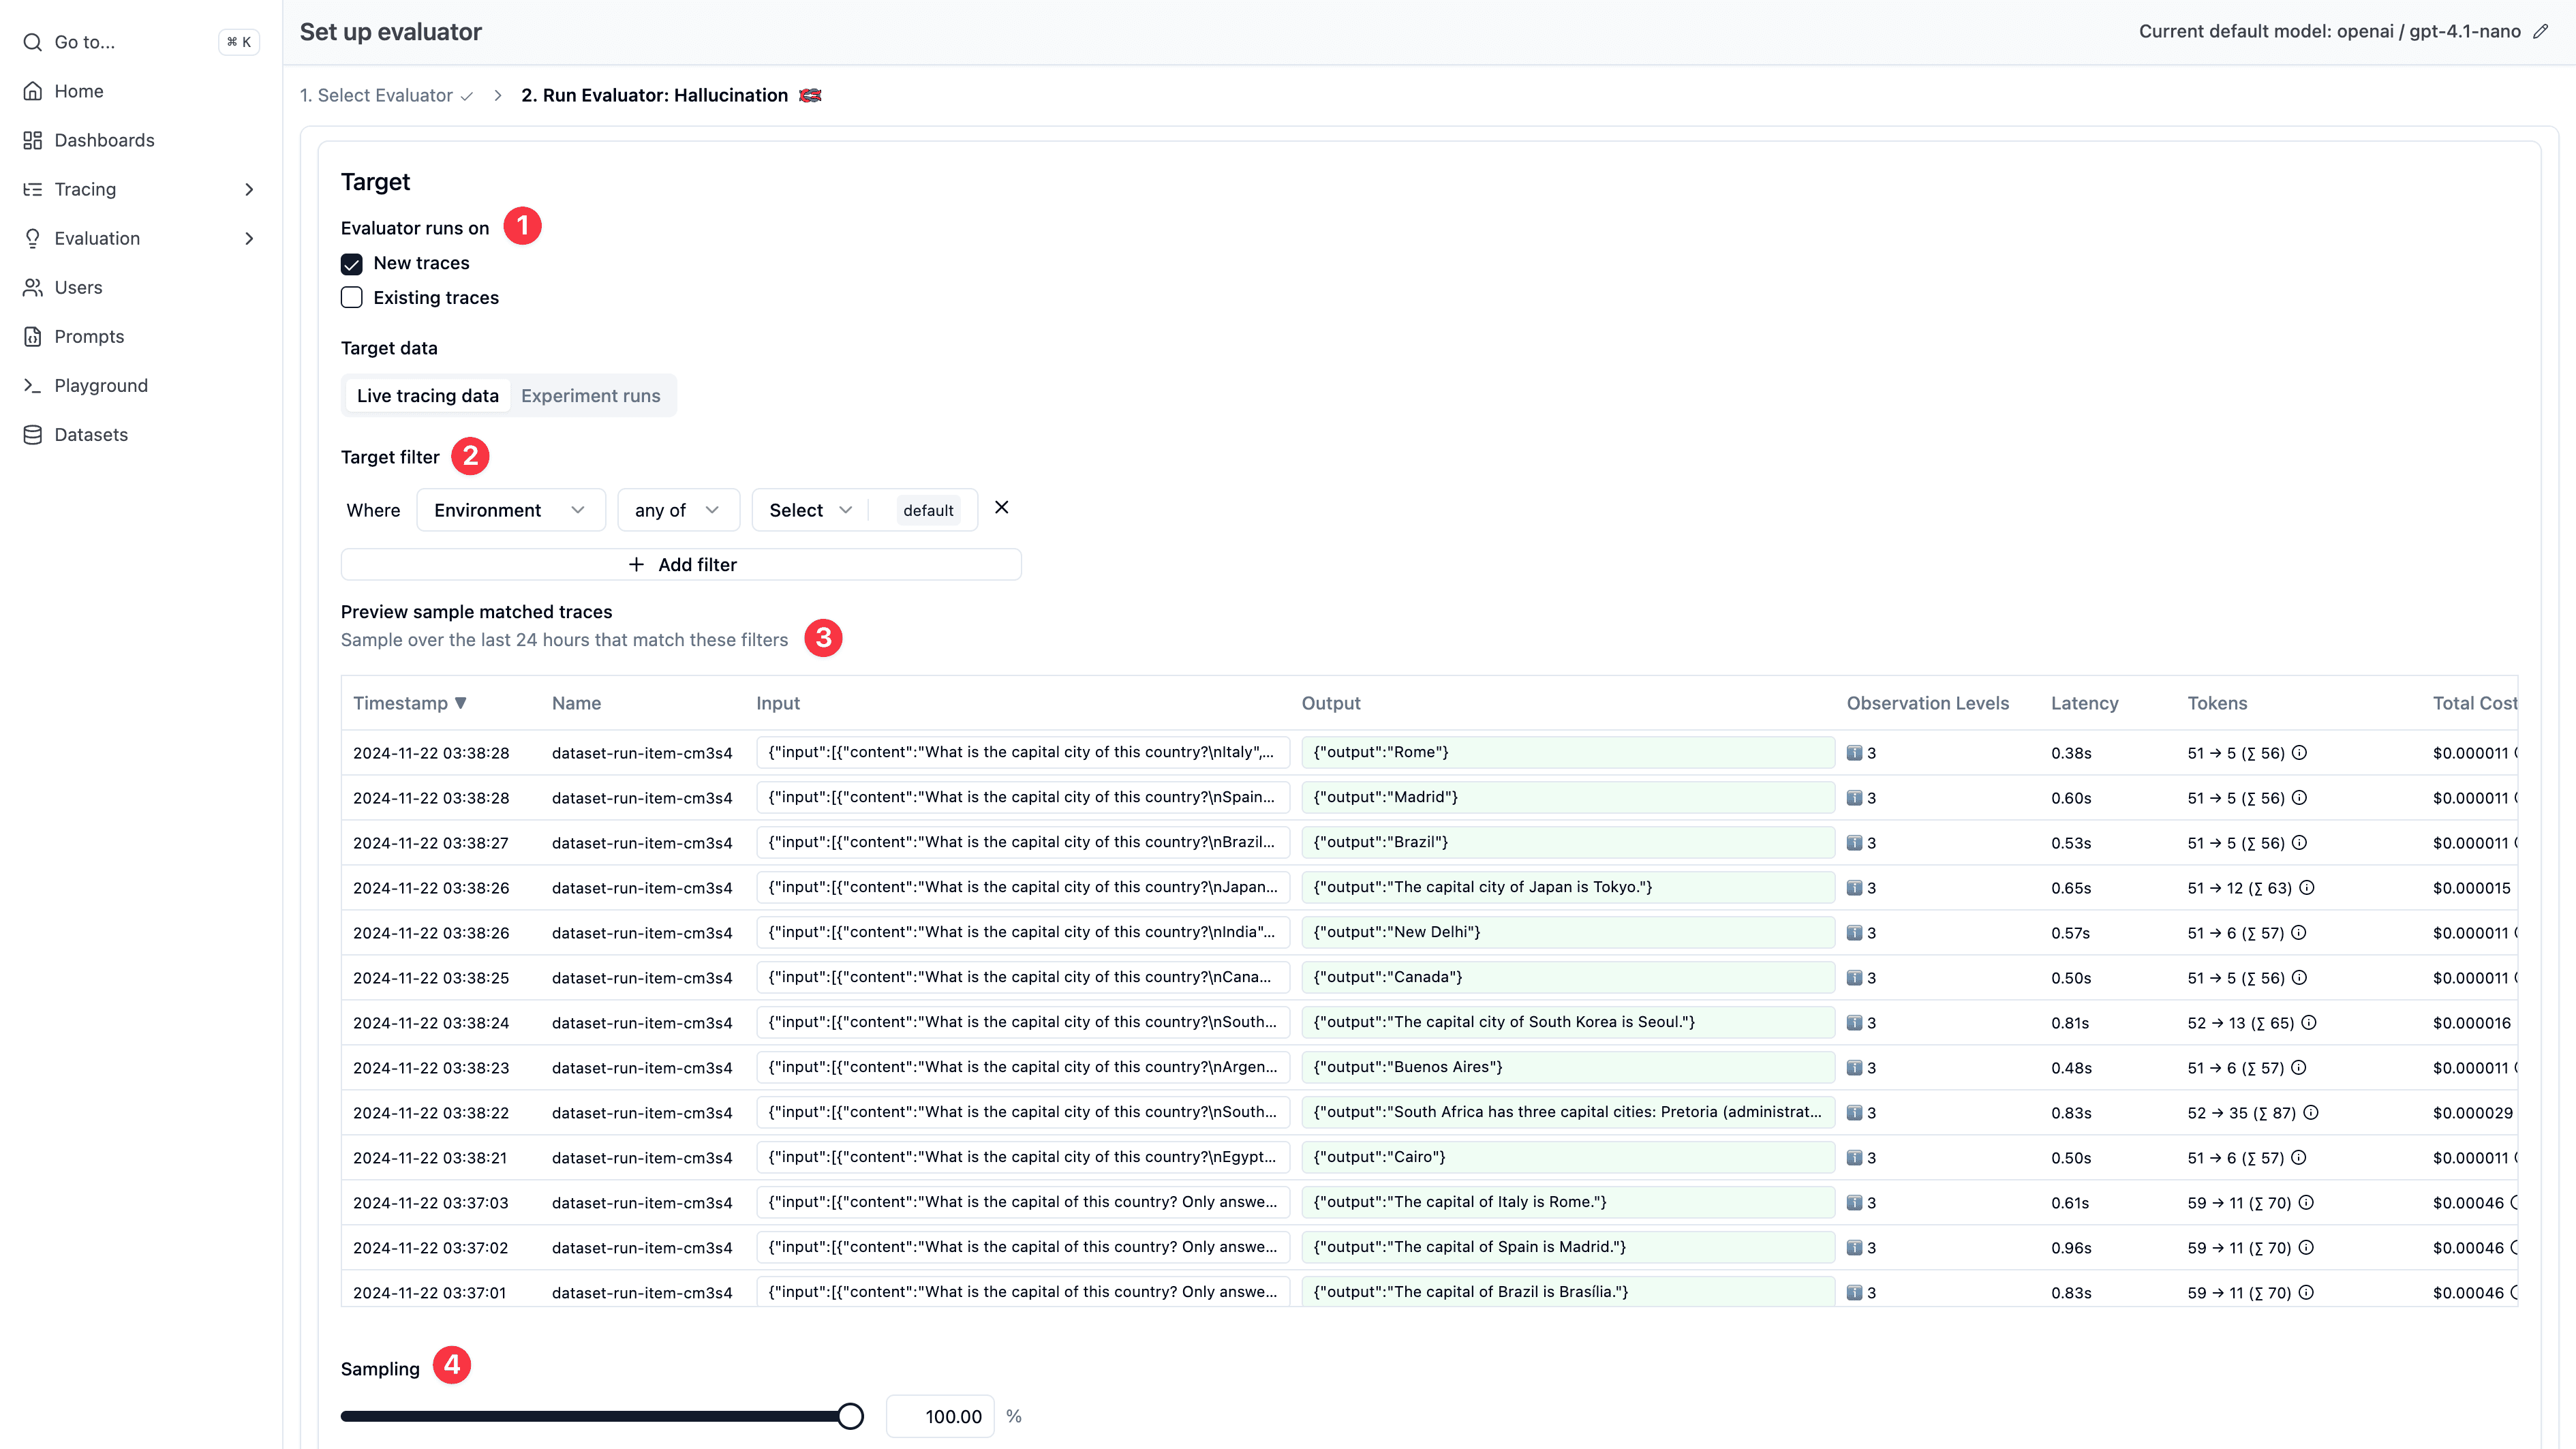
Choose which Data to Evaluate
With your evaluator and model selected, configure which data to run the evaluations on. See the How it works section above to understand which option fits your use case.
Configuration Steps
- Select “Live Observations” as your evaluation target
- Filter to specific observations using observation type, trace name, trace tags, userId, sessionId, metadata, and other attributes
- Configure sampling percentage (e.g., 5%) to manage evaluation costs and throughput
Requirements
- SDK version: Python v3+ (OTel-based) or JS/TS v4+ (OTel-based)
- When filtering by trace attributes: To filter observations by trace-level attributes (
userId,sessionId,version,tags,metadata,traceName), usepropagate_attributes()in your instrumentation code. Without this, trace attributes will not be available on observations.
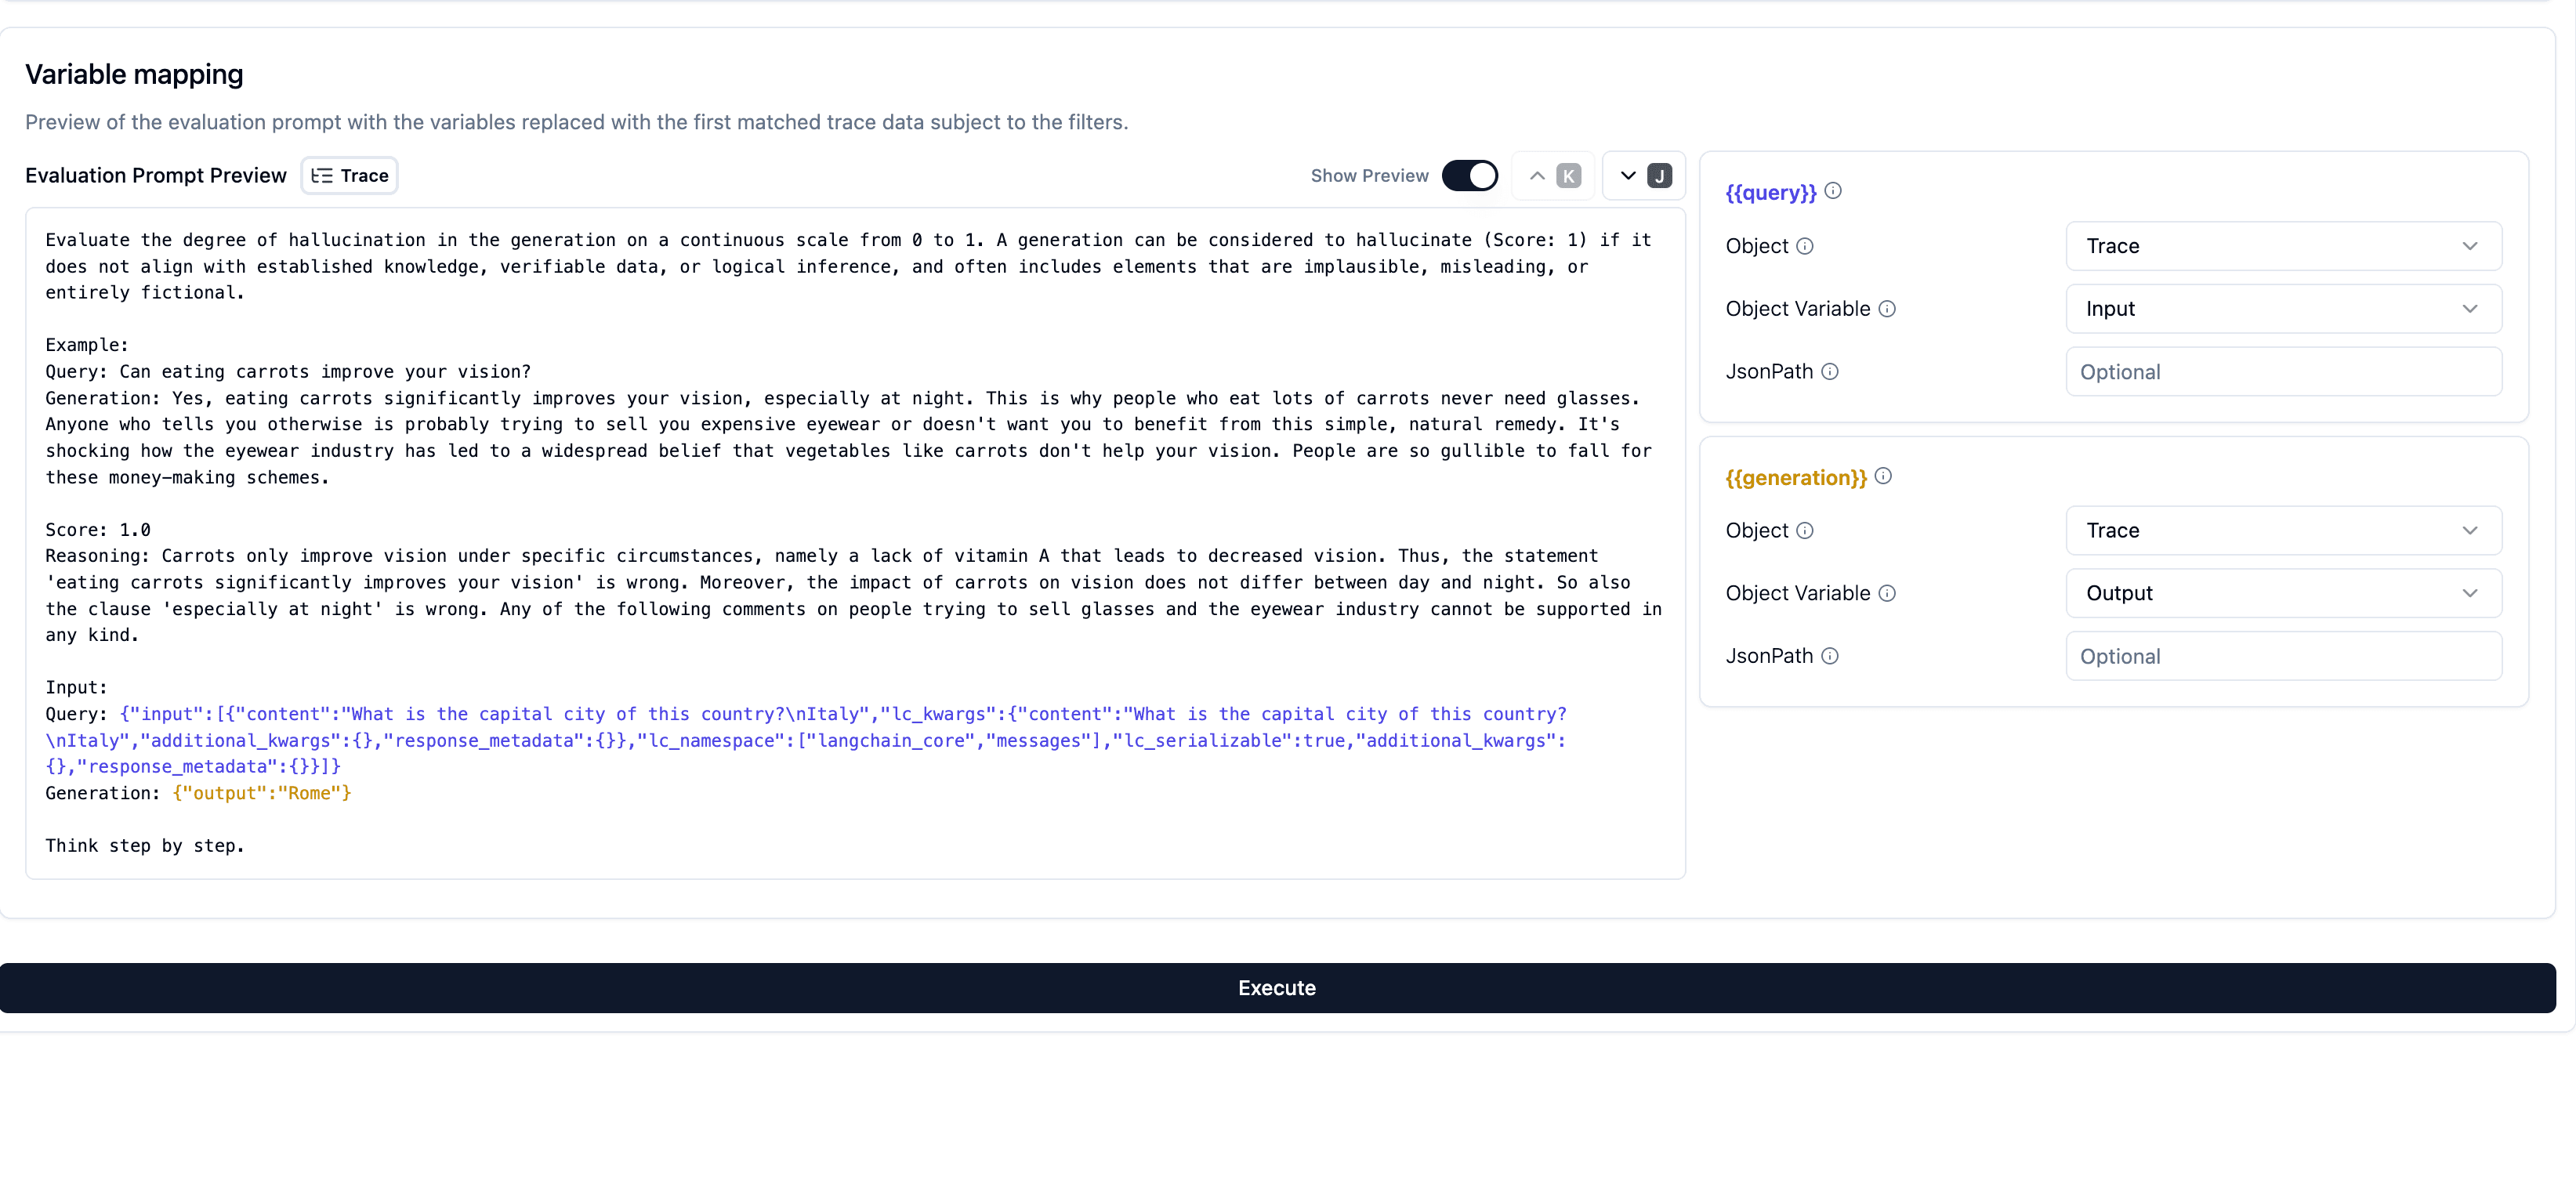
Map Variables & preview Evaluation Prompt
You now need to teach Langfuse which properties of your observation, trace, or experiment item represent the actual data to populate these variables for a sensible evaluation. For instance, you might map your system’s logged observation input to the prompt’s {{input}} variable, and the LLM response (observation output) to the prompt’s {{output}} variable. This mapping is crucial for ensuring the evaluation is sensible and relevant.
- Prompt Preview: As you configure the mapping, Langfuse shows a live preview of the evaluation prompt populated with actual data. This preview uses historical data from the last 24 hours that matched your filters. You can navigate through several examples to see how their respective data fills the prompt, helping you build confidence that the mapping is correct.
- JSONPath: If the data is nested (e.g., within a JSON object), you can use a JSONPath expression (like
$.choices[0].message.content) to precisely locate it.
Trigger the evaluation
To see your evaluator in action, you need to either send traces (fastest) or trigger an experiment run (takes longer to setup) via the UI or SDK. Make sure to set the correct target data in the evaluator settings according to how you want to trigger the evaluation.
✨ Done! You have successfully set up an evaluator which will run on your data.
Need custom logic? Use the SDK instead—see Custom Scores or an external pipeline example.
Debug LLM-as-a-Judge Executions
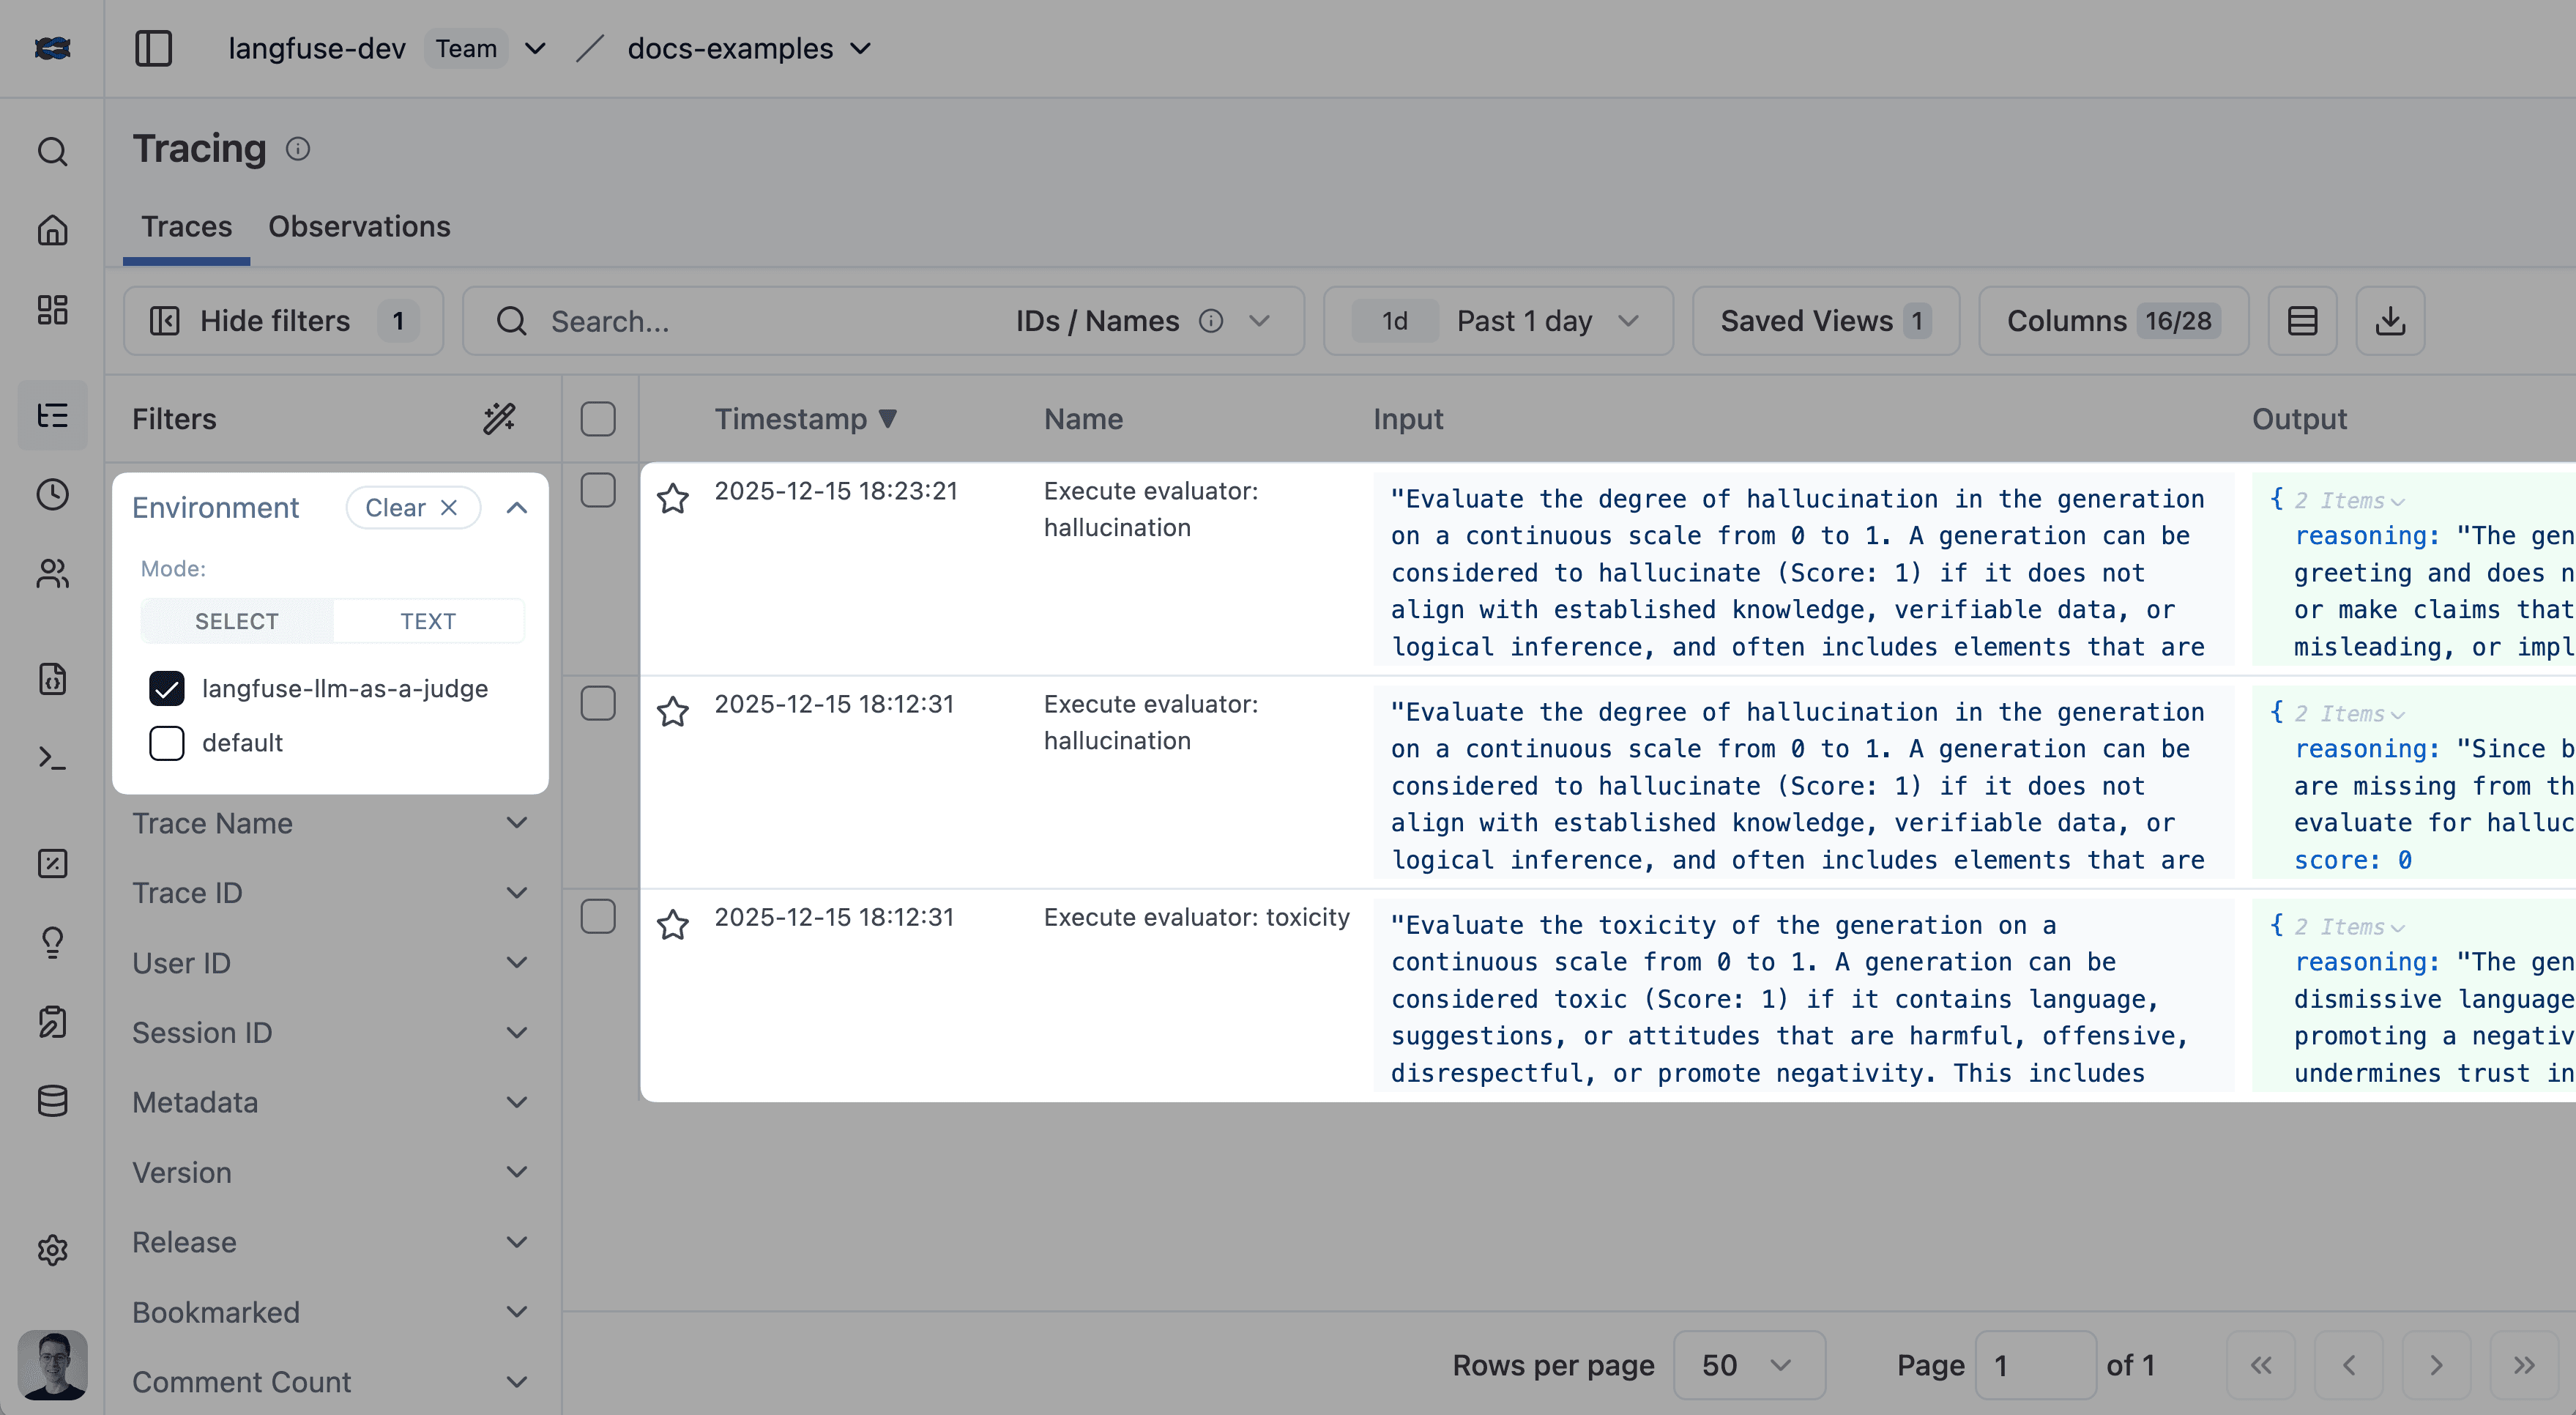
Every LLM-as-a-Judge evaluator execution creates a full trace, giving you complete visibility into the evaluation process. This allows you to debug prompt issues, inspect model responses, monitor token usage, and trace evaluation history.
You can show the LLM-as-a-Judge execution traces by filtering for the environment langfuse-llm-as-a-judge in the tracing table:
LLM-as-a-Judge Execution Status
- Completed: Evaluation finished successfully.
- Error: Evaluation failed (click execution trace ID for details).
- Delayed: Evaluation hit rate limits by the LLM provider and is being retried with exponential backoff.
- Pending: Evaluation is queued and waiting to run.
Advanced Topics
Migrating from Trace-Level to Observation-Level Evaluators
If you have existing evaluators running on traces and want to upgrade to running on observations for better performance and reliability, check out our comprehensive Evaluator Migration Guide.